- Breathwork is going well. Held for over 4min today without much struggle. Max is probably ~5min right now but I’ll do an official test soon.
- Amazon prime video (for tnf) doesn’t respect the latest version of chrome on linux and can’t play HD.
- Craig Wright claimed to be Satoshi. Hodlonaut called him a fraud. Wright sued for defamation. Lost.
- Liz Truss resigned (45 days).
- Tried a few new bloomberg publications: prognosis (medicine), politics, green (climate/energy), hyperdrive (cars).
- Starlink Aviation officially offered. One-time hw cost: 150k. Monthly service cost: 12-25k.
- Tried the homemade pickles today after 1day in the brine. Not pickly enough yet.
- Fungus in cancer cells? https://www.smithsonianmag.com/smart-news/scientists-are-finding-fungi-in-cancerous-tumors-180980881
- htmx exposes stuff like ajax and websockets directly to html. Small, fast. But proper/appropriate (over something built for this like jsx)? Maybe, maybe not.
- Pretty cool app: fireflies.ai
- Invites their bot to your google meet calendar items (or zoom, or teams…). It’s not an extension, it’s a third-party app that has access to your gcal.
- Business plan can: record video and allow you download audio/video/transcripts. You also get unlimited transcription. It’s $120/yr (per seat).
- I’m pretty sure you only get 1 transcription and no video records for the free plan (lol).
- Added all google accounts back to chrome (they were in Brave pretransition).
- Private work.
-
Friday
-
Thursday
Something new every day: Picked cucumbers. Full size, sliced into spears. Rice vinegar, salt, pepper, garlic, chili flakes, and homegrown dill.
- SBF’s twitter thread on crypto regulation: https://twitter.com/SBF_FTX/status/1582835426116575235
- And https://www.ftxpolicy.com/posts/possible-digital-asset-industry-standards
- 5-5 standard. Hackers/exploiters keep either 5% or 5M, whichever is smaller.
- Unsubscribed from a bunch that I usually gloss over:
- Marketwatch.
- Bloomberg Opinion – Points of Return (John Authors).
- Google’s new OS is KataOS. Mostly implemented in rust.
- Supercontest.
- https://gitlab.com/bmahlstedt/supercontest/-/issues/164.
- Currently running postgres 11.16. SELECT version();
- Major version 15 just came out.
- Upgraded.
- Rather than using pg_upgrade in place, just updated the docker image to postgres:15.
- And specified a new mount volume.
- pg_dump before and pg_restore after.
- Tested locally. Confirmed that score fetchs and picks still committed just fine.
- Unrelated – tested a few endpoints. statistics/ is obviously the most memory-heavy.
- Created a new ticket to fix/improve CICD: https://gitlab.com/bmahlstedt/supercontest/-/issues/165.
- Remember EKS gives you full control of the lower-level. ECS is a higher-level wrapper.
- Not using ECS since I don’t want orchestration yet, at least managed. I’ll run on my local k8s cluster if so.
- I can still use ECR (the container registry) as my artifact store. It’s pretty cheap, and I can slim down my images. Makes it easy to version, compare, restore, backup, more.
- I’ll only do this for the app image, obviously. The db container is backed up separately.
- The db is 120KB right now.
- The app image is 1.82GB total. But only 1.24 non-virtual, the writeable layer unique to each container. The rest is all shared layers that only count once across all versions.
- Say I slim it down to 1GB (def possible, it’s just a bunch of python wheels). ECR is $0.10/GB/mo. Double that for data transfer. So ECR will be about a quarter a month.
- You can just directly store your images on s3 (like any other files), but ECR does that under the hood anyway. It’s not either/or. ECR provides image-specific helpers like compression, encryption, security, etc; it’s s3 catered to docker images.
- And cloudformation is AWS terraform; infra as code. I’ll use that to deploy from ECR to EC2.
- https://gitlab.com/bmahlstedt/supercontest/-/issues/164.
- All 4 major sports (NFL/NBA/MLB/NHL) have games today – this is apparently only the 27th time this has ever happened.
- New AHS season started! AHS: NYC.
- Upgraded a few vscode extensions.
- Watched The Greatest Showman – didn’t realize it was a musical.
- Tesla’s mcap is about 4x SpaceX right now. It’s #5 overall, with the other 4 over 1T (apple, microsoft, alphabet, amazon).
- If you flip the side dnd switch on the iphone MID call, it will affect immediately. Surprising. I would have guessed the software checks at the beginning of the event, not continuously.
- Chess.
- Hans breaks the twitter silence after 6 weeks!
- https://twitter.com/HansMokeNiemann/status/1583164606029365248
- He filed a lawsuit against magnus, danny rensch, and hikaru.
- Alleged collusion between magnus group, chess.com, and affiliates.
- Basically that blacklisting has led and will lead to cancellations/uninvites that amount to 100M in career opportunity cost.
- Insane ending for women’s us chess championship, Krush/Yu. Went to tiebreaks after 2 weeks, each won 1 rapid, then armageddon saw a full piece blunder early by Yu only to later flag and win on time in a lost position.
- Hans breaks the twitter silence after 6 weeks!
- Remember that the porterhouse and tbone are both cut from the loin and both contain NY strip on one side of the bone and filet on the other. A porterhouse has more filet, a tbone has more strip. I prefer flavor over tenderness, so more strip and less filet, so tbone over porterhouse.
- Far from the rib section, where prime rib and ribeyes are cut. A tomahawk is a ribeye with the attached/frenched rib bone.
- The Sherman Act: https://en.wikipedia.org/wiki/Sherman_Antitrust_Act
- Antitrust. Prohibits anything that unfairly discourages competition. Prohibits anything that moves significantly toward monopolization.
- SBF’s twitter thread on crypto regulation: https://twitter.com/SBF_FTX/status/1582835426116575235
-
Wednesday
- Right now there are 1412 unicorns (https://news.crunchbase.com/unicorn-company-list/)
- Can’t put trash on the street until 8pm now (from 4pm) which should significantly help with the rats.
- Updated banner, committed lines, submitted picks.
- You can run
make build-start-prodwhile it’s running, now that I’m no longer railing mem. It recreates the app (obviously, with whatever changes you git pulled) and leaves the db unchanged smartly. - Had to update the line fetch to handle fractionals. Superbook started posting ½ instead of .5
- Also had to strip the apostrophe from 49’ers. The management of this table’s consistency is pure garbage.
- You can run
- Meal prep: made smoothies, powders, peanut butter, protein bars, liver, steak, hibiscus tea, oat milk.
- Fabi won US chess championship. Duda knocked Magnus out of aimchess.
- Finished Midnight Club. Flanagan definitely my favorite horror director right now.
- Nightmare Gothic LES!
- Coinbase Pro sunsetting, moving funds to Coinbase itself (Advanced Trading). It has the same lower fees.
-
Tuesday
Something new every day: Washed ~30 aquarium sock filters. Inside out. Hot. Bleach, no soap/detergent. Airdry.
- Ivan, from my aero/astro grad program, crypto fraud: https://www.nzherald.co.nz/nz/nz-scientist-ivan-ravlich-of-hypernet-labs-hit-with-us-crypto-fraud-lawsuit/TUHGTEKTWITBHB43DFJHLDVX3A/
- Huberman 2hr podcast on alcohol: https://www.youtube.com/watch?v=DkS1pkKpILY
- Heavy drinking is bad for your brain; we know this. Low-moderate is also bad. This is ~1-2 drinks a day, or 1-2 binge nights a week. The most common consumption class.
- Over time, neurodegeneration.
- Alcohol -> Acetaldehyde. Both are literal poisons.
- Prefrontal cortex (responsible for inhibition) is suppressed after a few drinks. Your voice increases, you move more. Chronic use can cause this increase to happen when sober as well. Your avg impulsivity increases in all phases.
- This also messes with temperature regulation. You feel fine in extreme temperatures, but you’ll get hyper/hypo thermic way more quickly. You’ll die from cold sleeping outside drunk way before sober under the same conditions.
- Eating food before or during drinking will slow the intake. It will not sober you up if you’re already drunk.
- Alcohol increases the conversion of testosterone to estrogen.
- Serotonin receptors increase activity after a few drinks, then drop rapidly with abuse.
- Hippocampus does memory formation; it is suppressed during a blackout.
- Alcohol consumption increases baseline (sober) cortisol release from adrenal glands. This increases anxiety. This reduces the ability to handle stress. Drinking to deal with stress…has the exact opposite effect.
- One of the best indicators for alcoholism predisposition = not being sedated by alcohol after a normal threshold. The people most awake at the afterparty.
- Alcohol affects gene expression. Increases risk for cancer. Particularly breast cancer.
- Liver breaks alcohol down, obviously.
- Alcohol destroys bacteria. The wrecks the microbiome. Your gut (from throat to stomach) is affected by alcohol in a negative way, reducing its ability to communicate effectively with the brain. Worst case is when the lining is disrupted so much that you get leaky gut.
- Best things for gut health (prebiotics/probiotics): low sugar, fermented, active foods. Kimchi, yogurt, pickles, sauerkraut, kombucha, etc.
- I’ve been sober for all of october now and feeling great. Better gym, better sleep, more time for both work and fun. Still doing all social stuff.
- Reinforced by this podcast. Not just gut health, but memory, inflammation, and repairing neural circuits damaged by alcohol (which can take 6mo+ of sobriety).
- Watched the 3hr Hikaru Lex Fridman (on 3x).
- NBA Season Opener, Warriors v Lakers.
-
Monday
- The Secretary of State is named A. Blinken.
- The Block is a web3 publication: https://www.theblock.co/
- Through the rush of sunday football on the first week of EC2 with double mem, looks fine and not leaky:
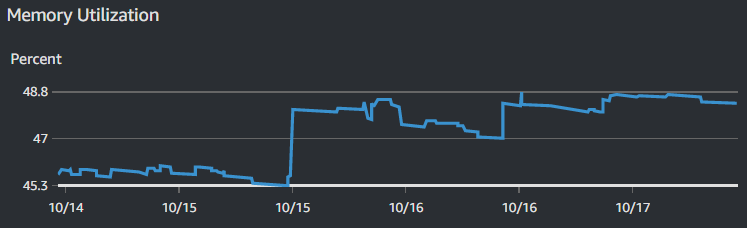
- 1GB was just a bit too small.
- Remember commercial banks vs boutique shops. The former usually has subdivisions; private bank, investment bank, wealth management, credit, mortgages, etc.
- Looked at Manhattan spooky attractions: Blood Manor, House of Spirits, Jekyll and Hyde’s Haunted Asylum, Blackout, Terror Haunted House, Nightmare Gothic. Got tickets for the last.
- Company work. Some legal, some pitch.
- ssh-keygen yf and E md5 lf to compare fingerprints of pubkeys with my private archive.
- Was having issues accessing the EC2 instance after I switched the keypair (from root user to iam user).
- The in-browser console connect capability of ec2 still works when you change access keys, but other usages do not. You obviously have to change your ssh client to use the new key (obviously, I did this), but ec2 does not automatically update the authorized_keys file.
- Run “ssh-keygen -f ~/.ssh/<>.pem -y” to get the pubkey and add that line to the authorized_keys file manually (via the ec2 console connect).
- Maybe EC2 does this automatically if you restart the instance or modify user data or something, but it’s a simple copy-paste to do it manually.
- Quant.
- HF, arb, bots, more. Many trading opportunities, algorithmic and automated.
- Develop a mathematical model. Backtest. Deploy.
- Feature extraction is kinda like dimensionality reduction. Take a complicated set of raw data and determine unique axes that matter.
- PCA (and ICA) are some methods of feature extraction (by determining magnitude/significance).
- Very common quant strategy = stat arb = statistical arbitrage.
- Analyze a TON of names and score them on arbitrage opportunity, then rank by risk.
- Hold the desired positions for a very short period of time (seconds to days, at most).
- Just like Pairs Trading. Coke is undervalued and pepsi is overvalued? Short pepsi and take a long position in coke. Briefly. This is done with groups of correlated names so that you can profit from both directions of the arb.
- Also called Mean Reversion. If there’s an expected normal (mean), you expect deviations to return to it (reversion). It’s the arbitrage opportunity.
- Overall: find names that are different from their expectation, and arb them back to the expectation (in pairs or groups of longs and shorts).
- 11st st jazz and comedy cellar 1130pm show.
-
Thursday
- Played with Linear, a new Jira-ish platform for issue tracking. It’s pretty sleek. https://linear.app/mahlstedt
- Cloudwatch.
- Created a custom dashboard for fun in cloudwatch for monitoring, then deleted.
- Basic monitoring is free and samples in 5min periods. To increase to 1min, you can enable Detailed Monitoring, but then you incur charges.
- EC2 doesn’t natively monitor memory. You have to manually install/configure the cloudwatch agent on the instance: https://docs.aws.amazon.com/AmazonCloudWatch/latest/monitoring/Install-CloudWatch-Agent.html
- wget https://s3.amazonaws.com/amazoncloudwatch-agent/ubuntu/amd64/latest/amazon-cloudwatch-agent.deb (just for x86-64 ubuntu).
- sudo dpkg -i -E ./amazon-cloudwatch-agent.deb
- Created the config /opt/aws/amazon-cloudwatch-agent/bin/config.json and had it collect mem_used_percent every 5 minutes.
- sudo /opt/aws/amazon-cloudwatch-agent/bin/amazon-cloudwatch-agent-ctl -a fetch-config -m ec2 -s -c file:/opt/aws/amazon-cloudwatch-agent/bin/config.json
- Created a CloudWatchAgentServerPolicy IAM role and associated it with the EC2 instance.
- Wait a few minutes after starting the cloudwatch agent. Then check cloudwatch in aws browser and you can visualize mem.
- It doesn’t list 22 as a supported ubuntu platform (yet), but it still worked. https://docs.aws.amazon.com/AmazonCloudWatch/latest/monitoring/Install-CloudWatch-Agent.html.
- I believe this will incur a slight cost because usage of the cloudwatch agent is considered a custom metric. We’ll see.
- Then added mem to the main EC2 and created a final dash: https://us-west-1.console.aws.amazon.com/cloudwatch/home?region=us-west-1#dashboards:name=EC2withMem
- Favorited some AWS services.
- Supercontest.
- Updated ansible.cfg to remote_user=ubuntu (it uses the current user otherwise, and bmahlstedt does not have access to my new ec2 instances).
- Moved the privkey spec to the hosts file instead of the makefile CLI calls.
- Pointed the privkey to the new pem instead of the old DO one.
- Confirmed that remote backup/restore works.
- IAM.
- Adjusted the root account, aliased to “mahlstedt” now (so I don’t have to login with the 12 digit account ID).
- Created usergroup Admin. Created user supercontest. Wanted a separate user so the root account doesn’t use its own access keys for daily tasks. The root account should just be used for billing, IAM, that sort of thing. I’ll use supercontest@mahlstedt for most.
- Cleaned all root access keys.
- Enabled MFA for root and supercontest users.
- Remember “supercontest” is just an IAM user, used to manage AWS permissions. So I will use it to handle EC2 and everything within the AWS mgmt console. I will log in as supercontest. But then on the EC2 instance, the app still runs as the default user “ubuntu” – no change there.
- In vscode, shift-alt then select columns and you can delete it like vim.
Memory Profiling Section
- Using filprofiler (pip install filprofiler).
- Then “fil-profile run <x>.py”
- filprofiler is more for jobs (ones that start and stop), not services (persistent).
- I’m more concerned with usage over time -> identifying memory leaks.
- Switched to packages that profile running apps. Looked at the builtin tracemalloc for a bit then opted for Pympler as a higher-level suite.
- Has a memory leak detection module (muppy) as well as a class tracker.
- Focusing on muppy – you basically call at the beginning (or end) of a function and then invoke the function a few times. It will delta which objects are new since last invocation. If nothing is diffed, nothing leaked. If some object is new, it stuck around, and will leak. You can whittle down to find it in code.
- Class tracker allows you to check which objects your program creates (and children/parents, it follows the whole object tree), and the size of each.
- On the matchups page refresh (just within function, no url preprocessor considerations)
types | # objects | total size ===================================== | =========== | ============ dict | 97 | 44.10 KB str | 72 | 11.58 KB set | 31 | 9.02 KB tuple | 60 | 4.22 KB weakref | 30 | 2.58 KB method | 30 | 2.11 KB sqlalchemy.orm.state.InstanceState | 30 | 1.88 KB sqlalchemy.util._collections.result | 14 | 1.20 KB int | 40 | 1.09 KB supercontest.models.models.Score | 14 | 896 B supercontest.models.models.Line | 14 | 896 B flask_sqlalchemy._DebugQueryTuple | 8 | 832 B datetime.datetime | 16 | 768 B float | 30 | 720 B supercontest.models.models.Week | 1 | 64 B- On the all-picks page refresh (just within function, no url preprocessor considerations)
types | # objects | total size ========================================= | =========== | ============ dict | 295 | 101.28 KB str | 240 | 14.50 KB set | 35 | 7.93 KB list | 33 | 4.99 KB tuple | 69 | 4.87 KB weakref | 34 | 2.92 KB method | 34 | 2.39 KB sqlalchemy.orm.state.InstanceState | 34 | 2.12 KB sqlalchemy.util._collections.KeyedTuple | 16 | 1.50 KB int | 45 | 1.23 KB supercontest.models.models.Line | 16 | 1024 B supercontest.models.models.Score | 16 | 1024 B datetime.datetime | 18 | 864 B float | 18 | 432 B flask_sqlalchemy._DebugQueryTuple | 1 | 104 B- On the leaderboard page refresh (just within function, no url preprocessor considerations)
types | # objects | total size =================================== | =========== | ============ dict | 242 | 121.92 KB tuple | 43 | 3.89 KB str | 3 | 3.88 KB set | 0 | 2.00 KB list | 17 | 1.96 KB list_iterator | 18 | 1.12 KB flask_sqlalchemy._DebugQueryTuple | 3 | 312 B float | 12 | 288 B zip | 1 | 72 B map | 1 | 64 B int | -2 | -56 B- This is not great. Means that in each call to (primarily) the allpicks and lb pages, we’re leaking a TON of objects. Totalling about 150KB in each call.
- Very very common places for memory leaks: every global var for the flask app. Not objects created inside the route, but anything in the global space (init, toplevel views, etc).
- For supercontest, all these objects: db, mail, cache, scheduler, csrf, app, blueprints.
- Pretty good overall video: https://www.youtube.com/watch?v=s9kAghWpzoE
- Remember autorestarts of workers/etc (esp for webservers) – very common bandaid solution to mem leaks. Can mask problems (but are a quick fix also).
- Went deeper and added /memory-print and /memory-snapshot endpoints to the main blueprint so that I could debug. Implemented tracemalloc.
---- Testing route /season2022/league0/week6/matchups over 50 calls Memory before: 180432896 Memory after: 180432896 Top 5 increases in mem by line: /usr/local/lib/python3.7/cProfile.py:87: size=70.1 KiB (-87.2 KiB), count=816 (-1015), average=88 B /usr/local/lib/python3.7/threading.py:904: size=60.6 KiB (+59.1 KiB), count=1723 (+1680), average=36 B /usr/local/lib/python3.7/pstats.py:248: size=54.9 KiB (-52.2 KiB), count=439 (-418), average=128 B /usr/local/lib/python3.7/cProfile.py:131: size=145 KiB (+49.7 KiB), count=1857 (+636), average=80 B /usr/local/lib/python3.7/site-packages/jinja2/nodes.py:220: size=10.1 KiB (-46.7 KiB), count=129 (-464), average=80 B ---- Testing route /season2020/league0/week3/picks over 50 calls Memory before: 180432896 Memory after: 180432896 Top 5 increases in mem by line: /usr/local/lib/python3.7/cProfile.py:87: size=69.9 KiB (-87.5 KiB), count=813 (-1018), average=88 B /usr/local/lib/python3.7/cProfile.py:67: size=0 B (-69.4 KiB), count=0 (-740) /usr/local/lib/python3.7/threading.py:904: size=69.2 KiB (+67.6 KiB), count=1967 (+1924), average=36 B /usr/local/lib/python3.7/pstats.py:248: size=54.9 KiB (-52.2 KiB), count=439 (-418), average=128 B /usr/local/lib/python3.7/site-packages/jinja2/nodes.py:220: size=10.1 KiB (-46.7 KiB), count=129 (-464), average=80 B ---- Testing route /season2021/league0/leaderboard over 50 calls Memory before: 180432896 Memory after: 180432896 Top 5 increases in mem by line: /usr/local/lib/python3.7/cProfile.py:87: size=70.1 KiB (-87.2 KiB), count=816 (-1015), average=88 B /usr/local/lib/python3.7/threading.py:904: size=77.6 KiB (+76.0 KiB), count=2205 (+2162), average=36 B /usr/local/lib/python3.7/pstats.py:248: size=56.6 KiB (-50.5 KiB), count=453 (-404), average=128 B /usr/local/lib/python3.7/cProfile.py:131: size=145 KiB (+49.9 KiB), count=1860 (+639), average=80 B /usr/local/lib/python3.7/site-packages/jinja2/nodes.py:220: size=10.1 KiB (-46.7 KiB), count=129 (-464), average=80 B -
Wednesday
- Again, it’s easiest to just manage hosts/users/identities in .ssh/config rather than the usual eval ssh-agent ssh-add in dotfiles and other config. The ssh config basically hardcodes the “ssh -i x y@z” into a single location, while giving it an alias. Eg right now it’s “ssh sbsc-aws” – extremely easy.
- Supercontest routing.
- Created a hosted zone for southbaysupercontest.com in route53. This automatically creates the NS and SOA records to AWS nameservers.
- SOA = start of authority.
- Allocated an elastic IPv4 address to my AWS account then associated it with the sbsc ec2 instance.
- These are free as long as they’re associated with a running instance (to discourage inefficiency). Each account is only allowed 5 ipv4 per region.
- Created A records for southbaysupercontest.com (and the www. subdomain) to point to the elastic IP.
- Route53 usually propagates DNS changes to authoritative servers within 60 seconds.
- Transferred the domain from GoDaddy to Route53. This process unlocks the domain and sends the admin (me) the auth code. Then you pay $12 over at Route53 for the transfer and it extends the original expiry a year. And you tell the registrar (this is the entry point) which nameservers to forward to (which you just created in your hosted zone).
- Everything is up now, just waiting for the registrar transfer. Once that’s done, it should automatically flow through the already-configured Route53 DNS nameservers to the elastic IP on my EC2 instance, already running the (pre-week-6) app and db containers.
- Manually approved the transfer on GoDaddy to speed the transfer process from ~7d to ~30min.
- Note too that AWS does not explicitly act as registrar, they use third-party services. But it’s all accessed/managed within Route53.
- Confirmed the full domain transfer with dig southbaysupercontest.com -> ec2 elastic ip.
- Overall, the godaddy -> route53 domain/registrar transfer took about 30min. Some waiting for godaddy, some waiting for aws. The DNS service transfer is easy, has no external gates, and should be done before domain.
- Transfer lock enabled on route53 after transfer (sets status codes like clientTransferProhibited, transferPeriod, etc).
- DNSSEC disabled.
- Started everything in order after the final routing changes: nginx-proxy, letsencrypt, sbsc app, db.
- Deleted the DO dns records, droplet, and project.
- Remember how this blog is configured for comparison:
- Created a hosted zone for southbaysupercontest.com in route53. This automatically creates the NS and SOA records to AWS nameservers.
Domain Registrar DNS Compute bmahlstedt.com GoDaddy DigitalOcean DigitalOcean (old) southbaysupercontest.com GoDaddy DigitalOcean DigitalOcean (new) southbaysupercontest.com Route53 Route53 EC2 - Ran a few windows updates.
- Committed week 6 lines.
- Second monitor.
- Still being laggy with media. Updated the drivers. Confirmed both monitors are set to 60Hz. Looks better now.
- Company work.
- Tyler Cowen wrote a crypto chapter.
- Caught up with Ben, great chat.
- Trivia at Amity Hall in Greenwich. Played with a girl who new gothamchess (Levi Rozman) growing up!