Connected with Rise again, dropoff for good morning america will be in 2 weeks.
SBSC.
Deleted the constants module and moved all vars to their appropriate modules (everything was single-use).
Moved COLOR_TRIO to the dimension definition where it belongs, not a default assumption of plotting utilities.
Removed sort_by. Everything is by trace value, sorted in trace order (first name = primary sort, second name = secondary sort, third name = tertiary sort, etc).
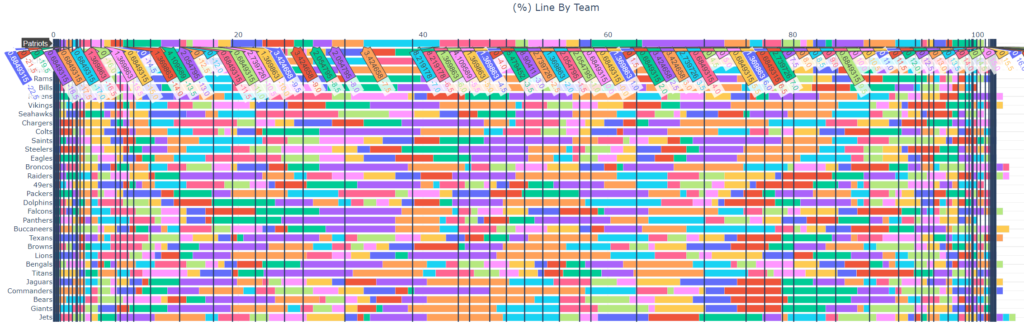
Made the xaxis (main dim) able to handle many many many traces:
This shows every line and the % of every team’s games that were that line (you could plot counts instead of %). The actual (valuable) plot uses the aggregation utility, of course – we care about the avg line by team.